
This Circular stipulates technical procedures for preparing underground water resource maps at a scale of 1:50,000, including contents such as methods to represent aquifer layers, potential exploitable reserves, underground water quality, underground water research points, current status and direction of underground water exploitation, other symbols on the map and cross-sections.
적용 범위
This Circular applies to the preparation of underground water resource maps at a scale of 1:50,000 throughout the country.
핵심 사항
- Methods to represent aquifer layers and potential exploitable reserves.
- Methods to represent underground water quality, including chemical composition of water, pollution indicators, and saline intrusion boundaries.
- Symbols for underground water research points such as hydrological stations, exploration wells, investigation wells, and exposed sources for investigation.
- Current status of underground water exploitation and direction of underground water resource utilization according to sub-watersheds or districts/cities/provinces.
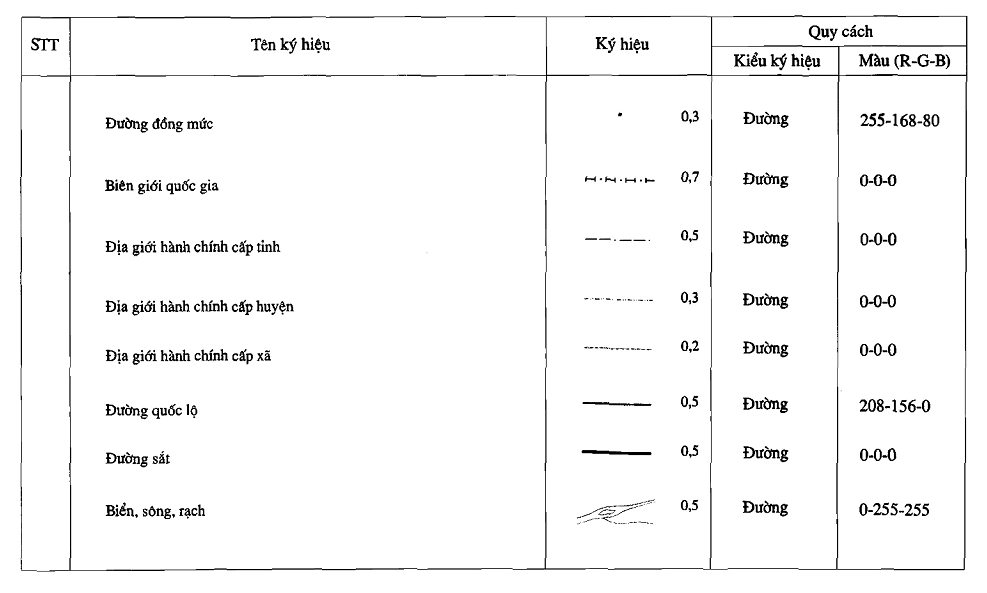
- Other symbols on the map such as tectonic faults, boundaries of complex aquifer systems, contour lines, national borders, administrative boundaries, and types of transportation routes.
- Methods to represent content and form of cross-sections of underground water resource maps.
🌐 이 문서의 사회적 영향
- To help manage and use underground water resources effectively.
- To support planning, surveying, and assessment of underground water resources.
- To provide scientific information for research, education, and training activities related to underground water resources.
❓ 자주 묻는 질문
When does this Circular take effect?
This Circular takes effect from August 5, 2013.
Who is responsible for implementing this Circular?
The Minister, Heads of Ministries equivalent to Ministries, agencies under the Government, Chairmen of People's Committees of provinces and centrally governed cities, Director of the Water Resources Management Agency, Director of the Center for Planning and Surveying of Water Resources, Heads of units under the Ministry, and relevant organizations and individuals are responsible for implementing this Circular.
What contents does the Appendix of this Circular include?
The Appendix of this Circular includes Guidelines for underground water resource maps at a scale of 1:50,000 and Technical Procedures for representing content and form of underground water resource maps at a scale of 1:50,000.
전문
| MINISTRY OF NATURAL RESOURCES AND ENVIRONMENT | SOCIALIST REPUBLIC OF VIET NAM Independence - Freedom - Happiness |
| Number: 15/2013/TT-BTNMT | Hanoi, June 21, 2013 |
CIRCULAR
Technical regulations for the creation of underground water resource maps at a scale of 1:50,000at a scale of 1:50,000
Pursuant to the Law on Water Resources No. 17/2012/QH13 dated June 21, 2012;
Pursuant to Decree No. 21/2013/NĐ-CP dated March 4, 2013, promulgated by the Government, stipulating the functions, tasks, powers, and organizational structure of the Ministry of Natural Resources and Environment;
Pursuant to Decree No. 24/2009/NĐ-CP dated March 5, 2009, of the Government detailing and providing measures for implementing the Law on Legislative Documents;
Considering the proposal of the Director General of the Water Resources Management Department, the Director of the Center for Water Resources Planning and Investigation, the Heads of the Science and Technology Department and the Legal Affairs Department;
The Minister of Natural Resources and Environment issues this Circular on technical regulations for the creation of underground water resource maps at a scale of 1:50,000,
PART I
GENERAL PROVISIONS
Article 1. Scope of Regulation and Applicability
Article 1. This Circular stipulates the contents, formats, and products of underground water resource maps at a scale of 1:50,000 for projects, programs, and tasks related to the investigation and assessment of underground water resources.
Article 2. This Circular applies to state management agencies for water resources, organizations, and individuals who create underground water resource maps at a scale of 1:50,000.
Article 2. Purpose of creating underground water resource maps at a scale of 1:50,000
Point 1. To reflect the results of the investigation and assessment of underground water resources at a scale of 1:50,000 or at a larger scale.
Point 2. To serve state management of water resources and the exploitation and utilization of underground water resources in provinces and centrally-administered cities and within provincial river basins (provincial river basins are determined according to Decision No. 341/QĐ-BTNMT dated March 23, 2012 of the Minister of Natural Resources and Environment on the list of provincial river basins).
Point 3. To serve the preparation of underground water resource plans and socio-economic development plans in provinces and centrally-administered cities and within provincial river basins.
Point 4. To serve the needs of exploiting and using information for sectors, localities, organizations, and individuals involved in the exploitation and utilization of water resources.
Article 3. Base maps in the creation of underground water resource maps at a scale of 1:50,000
Clause 1. Underground water resource maps at a scale of 1:50,000 are created based on topographic base maps and hydrogeological base maps at the same scale or a larger scale.
Clause 2. The topographic base map is a topographic map at a scale of 1:50,000 (VN2000 coordinate system) or a larger scale, compiled at a scale of 1:50,000, issued by the Ministry of Natural Resources and Environment.
Clause 3. The hydrogeological base map is a hydrogeological map at a scale of 1:50,000 or a larger scale, compiled at a scale of 1:50,000. The hydrogeological map serves to determine the distribution area, water storage capacity, chemical composition, and exploitable water volume of underground water sources, as well as stratigraphic intervals and aquifer structures.
Clause 4. In cases where there are no existing hydrogeological maps in the areas where the maps are being created, it is necessary to conduct investigations and draw up hydrogeological maps with sufficient information to ensure the creation of underground water resource maps.
Article 4. Technical inspection and product acceptance work
Technical inspection work and product acceptance shall be carried out in accordance with the current regulations of the Ministry of Natural Resources and Environment.
Article 5. Product types
Clause 1. Products of underground water resource maps at a scale of 1:50,000 include:
Subpoint a) Underground water resource map;
Subpoint b) Specialized maps:
- Map of actual data on underground water resources;
- Map of underground water quality;
- Map of groundwater flow modulus.
Subpoint c) Description of the underground water resource map;
Subpoint d) Appendices: summary tables and statistics of comprehensive and detailed investigation results according to aquifer structures and administrative units; table of detailed investigation points and other information. Cross-section drawings and other diagrams.
Clause 2. Underground water resource maps at a scale of 1:50,000 are published in paper and digital formats.
Article 6. Mathematical Basis for the Groundwater Resources Map at Scale 1:50,000
1. The groundwater resources map at scale 1:50,000 shall be established within the National Reference System and National Coordinate System VN2000 (UTM Grid, WGS84 Ellipsoid, Zone 60, scale factor k0 = 0,9996).
2. The central meridian of the groundwater resources map at scale 1:50,000 shall be determined according to Table 1.
Table 1. Central Meridians According to Projection Zones
|
Serial number |
Left Meridian |
Axis Meridian |
Right Meridian |
|
Zone 48 |
1020 |
1050 |
1080 |
|
Zone 49 |
1080 |
1110 |
1140 |
|
Zone 50 |
1140 |
1170 |
1200 |
3. The map frame, grid lines of longitude and latitude of the groundwater resources map at scale 1:50,000 shall display both systems of longitude and latitude grids and kilometer grids, in accordance with the current regulations for topographic maps of equivalent scales.
4. In cases where the map is established for localities, the topographic map system will use projection zones with central meridians suitable for the geographic location of each province and centrally governed city as shown in Table 2.
Table 2. Central Meridians of Localities
|
No. |
Finance - Accounting |
Axis Meridian |
No. |
Finance - Accounting |
Axis Meridian |
|
1 |
Lai Chau |
103000’ |
12 |
Vinh Phuc |
105000’ |
|
2 |
Dien Bien |
103000’ |
13 |
Hau Giang |
105000’ |
|
3 |
Son La |
104000’ |
14 |
Dong Thap |
105000’ |
|
4 |
Kien Giang |
104030’ |
15 |
Can Tho |
105000’ |
|
5 |
Ca Mau |
104030’ |
16 |
Bac Lieu |
105000’ |
|
6 |
Lao Cai |
104045’ |
17 |
Hanoi |
105000’ |
|
7 |
Yen Bai |
104045’ |
18 |
Ninh Binh |
105000’ |
|
8 |
Nghe An |
104045’ |
19 |
Ha Nam |
105000’ |
|
9 |
Phu Tho |
104045’ |
20 |
Ha Giang |
105030’ |
|
10 |
An Giang |
104045’ |
21 |
Hai Duong |
105030’ |
|
11 |
Thanh Hoa |
105000’ |
22 |
Ha Tinh |
105030’ |
|
No. |
Finance - Accounting |
Axis Meridian |
No. |
Finance - Accounting |
Axis Meridian |
|
23 |
Bac Ninh |
105030’ |
44 |
Thai Nguyen |
106030’ |
|
24 |
Hung Yen |
105030’ |
45 |
Bac Giang |
107000’ |
|
25 |
Thai Binh |
105030’ |
46 |
Thua Thien Hue |
107000’ |
|
26 |
Nam Dinh |
105030’ |
47 |
Lang Son |
107015’ |
|
27 |
Tay Ninh |
105030’ |
48 |
Kon Tum |
107030’ |
|
28 |
Vinh Long |
105030’ |
49 |
Quang Ninh |
107045’ |
|
29 |
Soc Trang |
105030’ |
50 |
Dong Nai |
107045’ |
|
30 |
Tra Vinh |
105030’ |
51 |
Bien Hoa - Vung Tau |
107045’ |
|
31 |
Cao Bang |
105045’ |
52 |
Quang Nam |
107045’ |
|
32 |
Long An |
105045’ |
53 |
Lam Dong |
107045’ |
|
33 |
Tien Giang |
105045’ |
54 |
Da Nang |
107045’ |
|
34 |
Ben Tre |
105045’ |
55 |
Quang Ngai |
108000’ |
|
35 |
Haiphong |
105045’ |
56 |
Ninh Thuan |
108015’ |
|
36 |
City Ho Chi Minh |
105045’ |
57 |
Khanh Hoa |
108015’ |
|
37 |
Binh Duong |
105045’ |
58 |
Binh Dinh |
108015’ |
|
38 |
Tuyen Quang |
106000’ |
59 |
Dak Lak |
108030’ |
|
39 |
Hoa Binh |
106000’ |
60 |
Dak Nong |
108030’ |
|
40 |
Quang Binh |
106000’ |
61 |
Phu Yen |
108030’ |
|
41 |
Quang Tri |
106015’ |
62 |
Gia Lai |
108030’ |
|
42 |
Binh Phuoc |
106015’ |
63 |
Binh Thuan |
108030’ |
|
43 |
Bac Kan |
106030’ |
Chapter II
CONTENT OF THE GROUNDWATER RESOURCES MAP AT SCALE 1:50,000
Article 7. Base elements
1. Topographic base elements
On the groundwater resources map at scale 1:50,000, the following topographical elements must be ensured to be displayed:
a) Mathematical base layer: map name, grid frame, elements outside the frame;
b) Topography layer: contour lines, elevation points, elevation values;
c) Hydrographic layer: rivers, streams, lakes and their names;
d) Transportation layer: roads, railways, bridges and their names;
đ) Population layer: concentrated residential areas, clusters of residents;
e) Administrative layer: headquarters of district and provincial People's Committees; administrative unit names;
g) Boundary layer: district, provincial boundaries, international borders, sub-watershed and river watershed boundaries.
Detailed topographical elements must comply with the provisions of geographical information standards issued by the Ministry of Natural Resources and Environment. Topographical background elements may be reduced by 15 to 25% to ensure priority in displaying groundwater resource elements.
2. Background hydrogeological elements
Background hydrogeological elements displayed on the groundwater resources map at scale 1:50,000 include:
a) Distribution areas of water-bearing and non-water-bearing objects including: aquifer complexes, aquifers and formations, non-aquifer complexes;
b) Water-bearing faults, predicted water-bearing faults, and faults with undetermined water-bearing conditions;
c) Quality of groundwater.
Article 8. Specialized Elements
Information displayed on the groundwater resources map at scale 1:50,000 includes:
1. Distribution areas, including: water-bearing and non-water-bearing objects.
2. Underground water reserves, including:
a) Potential underground water extraction reserves;
b) Evaluated underground water extraction reserves.
3. Groundwater quality, including:
a) Chemical composition of water;
b) Signs of groundwater pollution;
c) Salinity boundary of aquifers.
4. Current status of groundwater extraction, including:
a) Concentrated water supply facilities;
b) Individual extraction facilities;
c) Data on the current status of groundwater extraction.
5. Direction of groundwater extraction, including:
a) Extraction flow rate;
b) Extraction threshold limit;
c) Prohibited and restricted extraction zones (if required and reliable data are available).
Chapter III
TECHNIQUES FOR DISPLAYING THE GROUNDWATER RESOURCES MAP AT SCALE 1:50,000 AT A SCALE OF 1:50,000
Article 9. Format of the Groundwater Resources Map at Scale 1:50,000
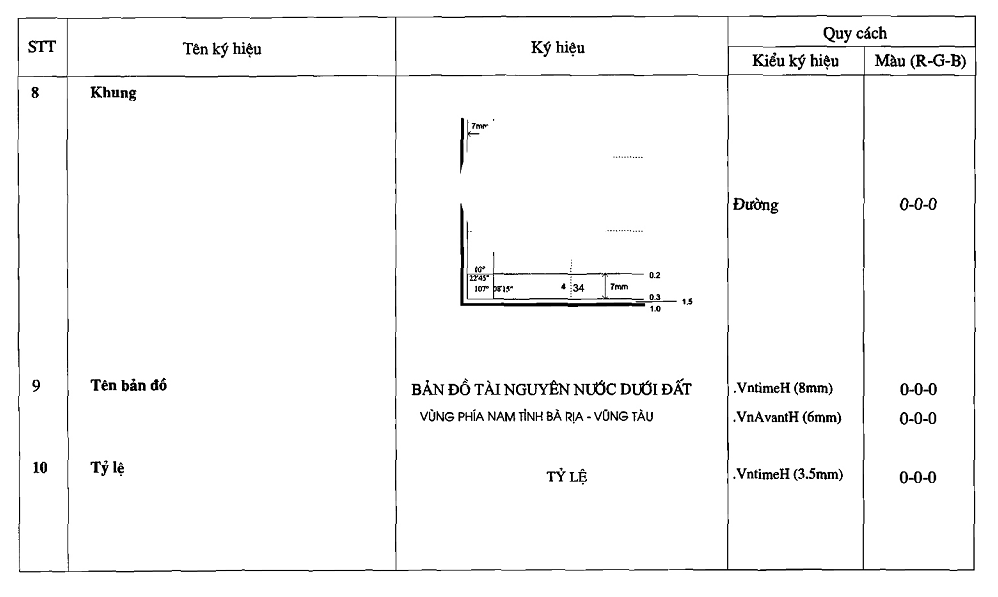
1. The map name and frame shall be displayed according to the provisions in the annex accompanying this regulation.
2. If the map consists of multiple pieces, a corner assembly diagram shall be displayed on the right side of the map frame.
3. The map legend shall be placed on the right side of the map, cross-sections shall be placed below the map. Where possible, the legend and cross-sections may be placed within the frame at appropriate positions.
Article 10. Technical Representation of Content for Underground Water Resources Maps at Scale 1:50,000
1. Principles of Representation
Underground water resources maps at scale 1:50,000 must reflect the results of research conducted during the investigation and assessment of underground water resources at scale 1:50,000. The contents and information displayed on underground water resources maps at scale 1:50,000 shall be based on the following principles:
a) Water-bearing and non-water-bearing objects shall be represented according to their distribution boundaries;
b) Potential exploitable reserves shall be represented in the form of areas;
c) Underground water reserves that have been assessed shall be represented through approved reserve levels, shown with frames and values of each level;
d) Underground water quality shall be represented in the form of lines and points;
đ) Contaminated and polluted areas shall be represented using point (contaminated point) and dotted area (polluted area) forms;
e) Artificial structures such as hydrological stations, drilled wells, dug wells, and exposed underground water sources shall be represented using point forms;
g) Underground water extraction facilities shall be represented using point symbols and only facilities with capacity ≥ 20m³/day shall be shown;3Initially, meet the demand by improving and upgrading Tam Phu Nhan reservoir with a capacity of 120,000 m
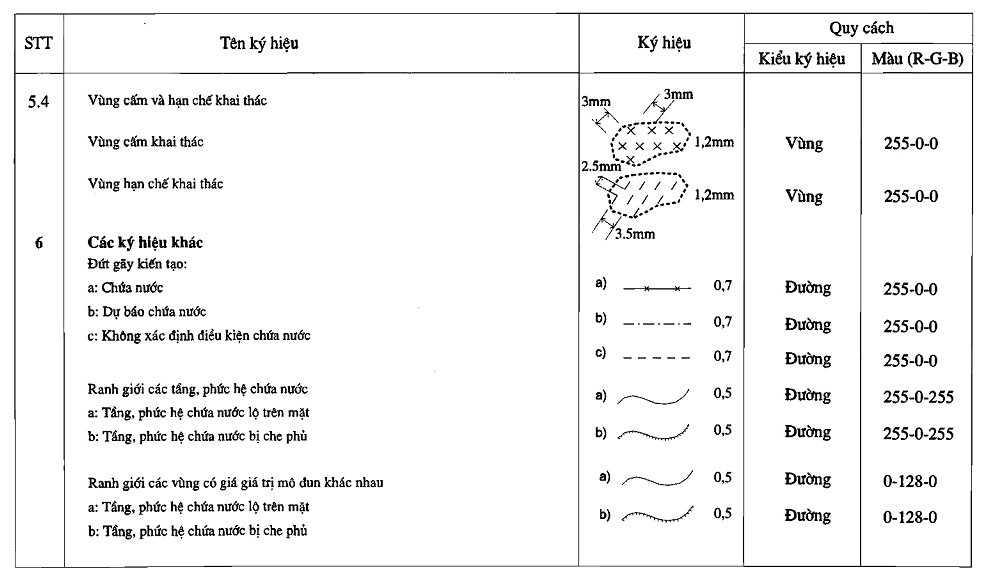
h) Faults on underground water resources maps at scale 1:50,000 shall represent water-bearing, predicted water-bearing, and undetermined water-bearing conditions faults, shown with red lines, thick strokes;
i) Directions for the exploitation and utilization of underground water shall be represented using tables of data accompanied by related information.
2. Size of Represented Objects
On underground water resources maps at scale 1:50,000, objects represented in area form must have actual sizes greater than or equal to 0.25km²; objects represented in line form must have actual lengths greater than or equal to 500m; on cross-sections, objects must have actual thicknesses greater than or equal to 5m, extending a minimum of 500m.2; objects represented in line form must have an actual length of 500 meters or more; on cross-sections, objects to be depicted must have an actual thickness of 5 meters or more, extending for a minimum of 500 meters.
3. Map Representation Techniques
a) Complex systems, aquifers, and non-water-bearing formations:
- Each complex system, aquifer shall display information, existence form, name of the complex system, and distribution area;
- Boundaries of complex systems, aquifers on the surface shall be shown with continuous purple lines, 0.4mm thick; for covered complex systems, aquifers, continuous purple lines, 0.4mm thick, with arrows pointing towards the distributed complex system, aquifer;
- Non-water-bearing formations, complexes shall be shown with brown areas.
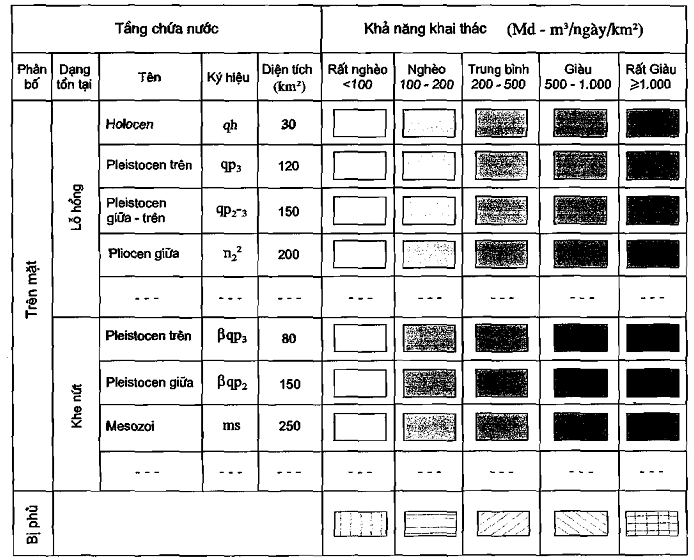
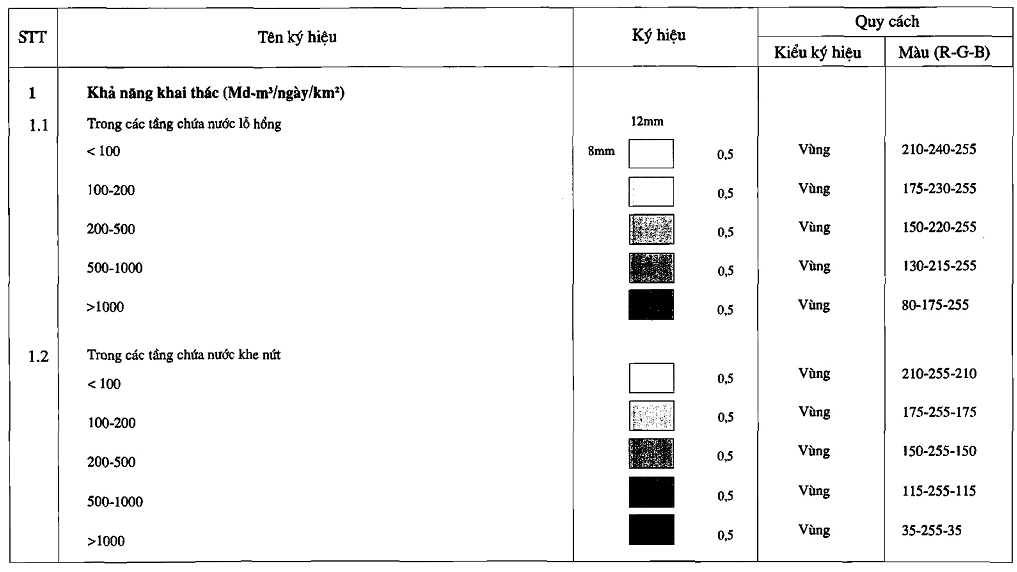
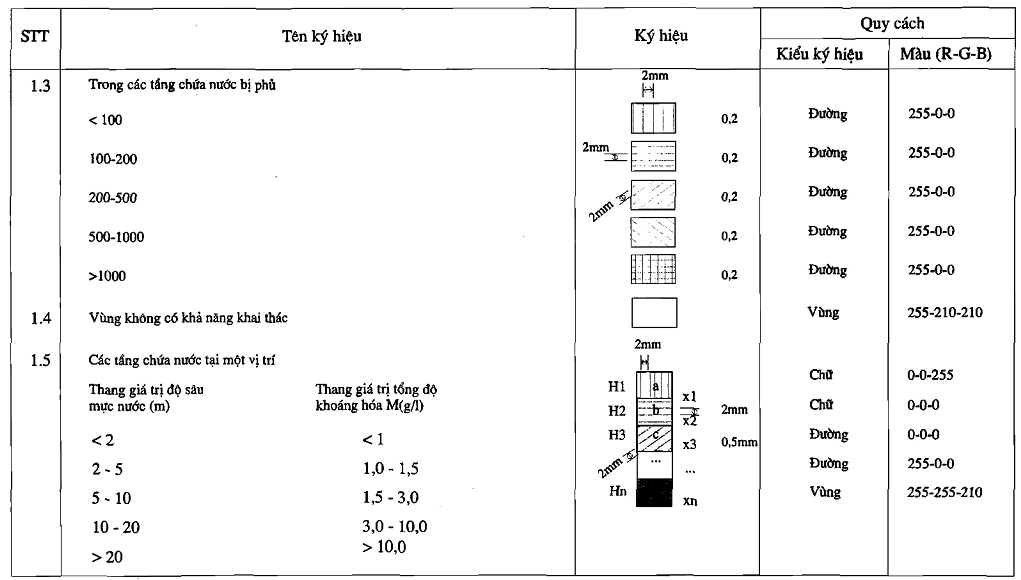
b) Potential exploitable reserves classified as very poor, poor, medium, rich, and very rich shall be represented by varying shades of color intensity.
- For exposed surface karst aquifers, they shall be shown with blue areas;
- For exposed fracture aquifers, they shall be shown with green areas;
- For covered aquifers, they shall be shown with brown striped lines, 1mm thick, spaced 3mm apart (only shown at representative points);
- For areas without potential for underground water exploitation, they shall be shown with brown backgrounds and black borders, 1mm thick.
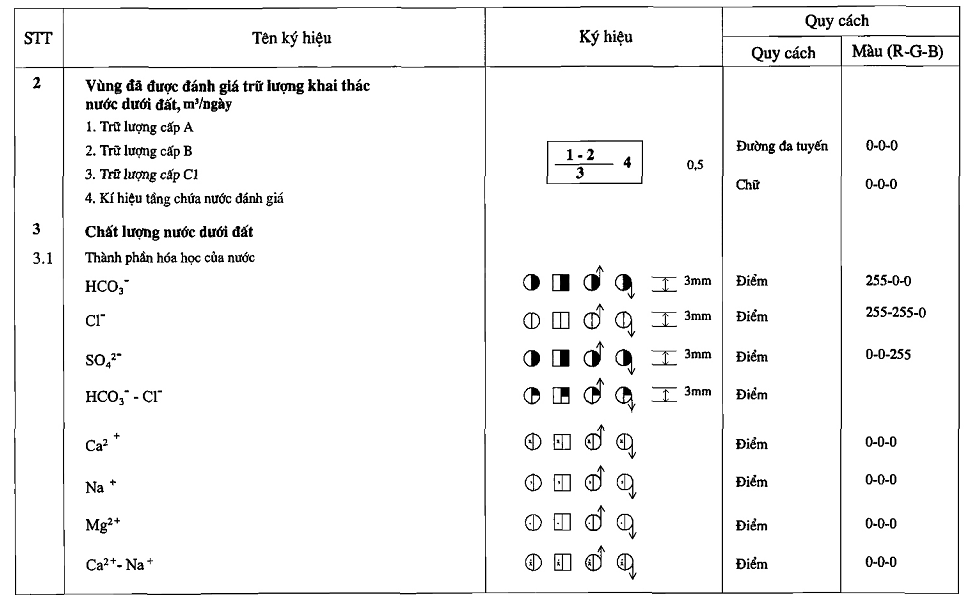
c) Assessed underground water reserves shall be represented with black frames, 1mm thick, and black numbers indicating reserve levels and evaluated water-bearing unit symbols.
d) Underground water quality: different regions with varying water quality shall be divided based on total mineralization values according to the scale (unit g/l): < 1; 1 ÷ 1.5; 1.5 ÷ 3; 3 ÷ 10 and ≥ 10.
- First-level aquifers on the map shall be shown with orange contour lines, 0.5mm thick, along with values, aquifer names, and arrows pointing towards higher total mineralization;
- Covered aquifers on the map shall only be shown with saline intrusion boundary lines, M = 1g/l, orange, 0.5mm thick, along with arrows pointing towards higher total mineralization and colors according to the scale at representative points.
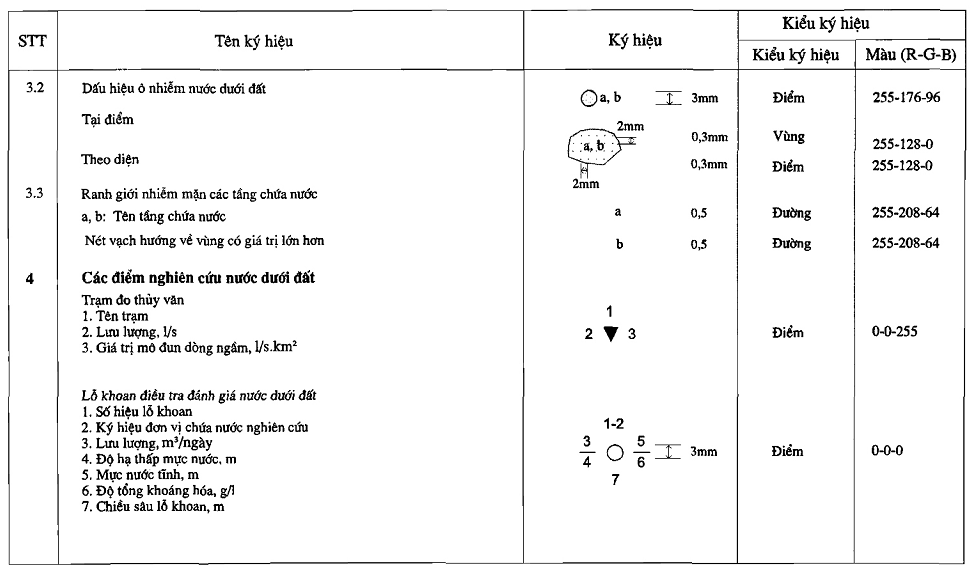
đ) Groundwater pollution indicators shall only show trace elements, nitrogen, pesticide residues, and microbial values exceeding National Technical Regulations on Underground Water Quality (QCVN09/2008/BTNMT).
- Contaminated points shall be shown with brown circles, 3mm diameter, accompanied by contaminant factor names and aquifer names;
- Polluted areas: shall be shown with brown-yellow dotted areas and brown-yellow border lines, 0.3mm thick, accompanied by contaminant factor names and aquifer names.
e) Groundwater study points:
- Hydrological stations shall be shown with downward-pointing blue triangles, 3mm high, accompanied by station name, flow rate, and groundwater modulus value;
- Drilled wells shall be shown with black circles, 3mm diameter, accompanied by well number, studied water-bearing unit symbol, flow rate, drawdown, static water level, total mineralization, and well depth;
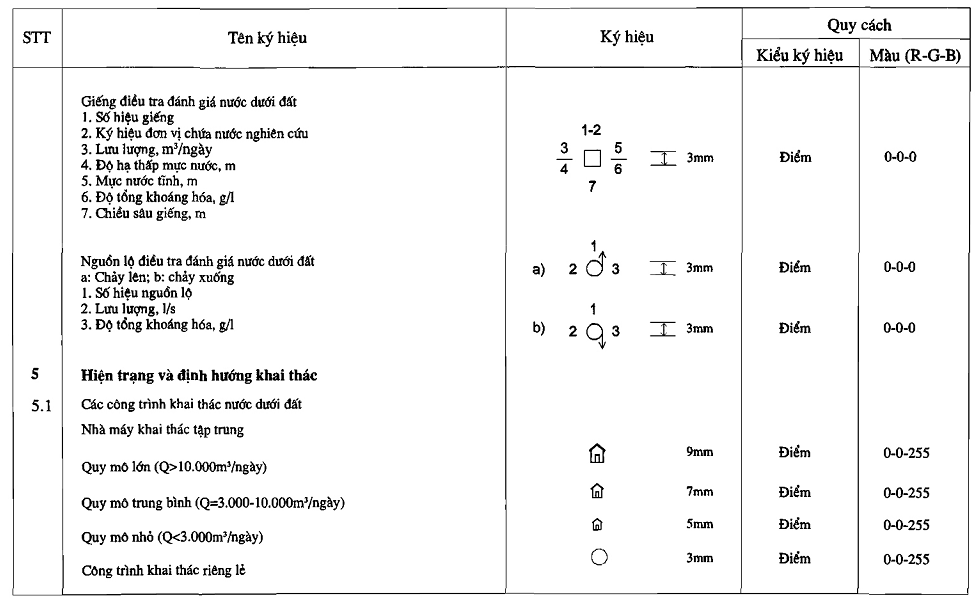
- Dug wells shall be shown with black squares, 3mm side length, accompanied by well number, studied water-bearing unit symbol, static water level, flow rate, drawdown, total mineralization, and well depth;
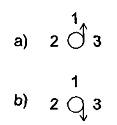
- Springs shall be shown with black circles, 3mm diameter, with upward or downward arrows depending on whether the spring flows up or down, accompanied by spring number, flow rate, and total mineralization.
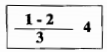
g) Representative positions of aquifers shall be shown with square columns including: top and bottom depths, water level depth, modulus and total mineralization values of each aquifer present in the area (using colors according to the scale).
h) Underground water extraction facilities:
- For large-scale facilities (≥ 10,000m³/day), medium-scale (3,000 - 10,000m³/day), and small-scale (< 3,000m³/day) centralized water supply projects, symbols will be used according to their scale;3per day), average (3,000 - 10,000m3per day) and small (< 3,000 m3per day);
- For individual extraction facilities, they shall be marked with red circles, 3mm diameter.
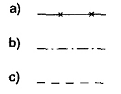
i) Faults shall be shown with red lines, 0.7mm thick. Water-bearing faults shall be shown with continuous lines with multiplication signs (x), predicted water-bearing faults with dashed lines with dots (.), and undetermined water-bearing condition faults with dashed lines.
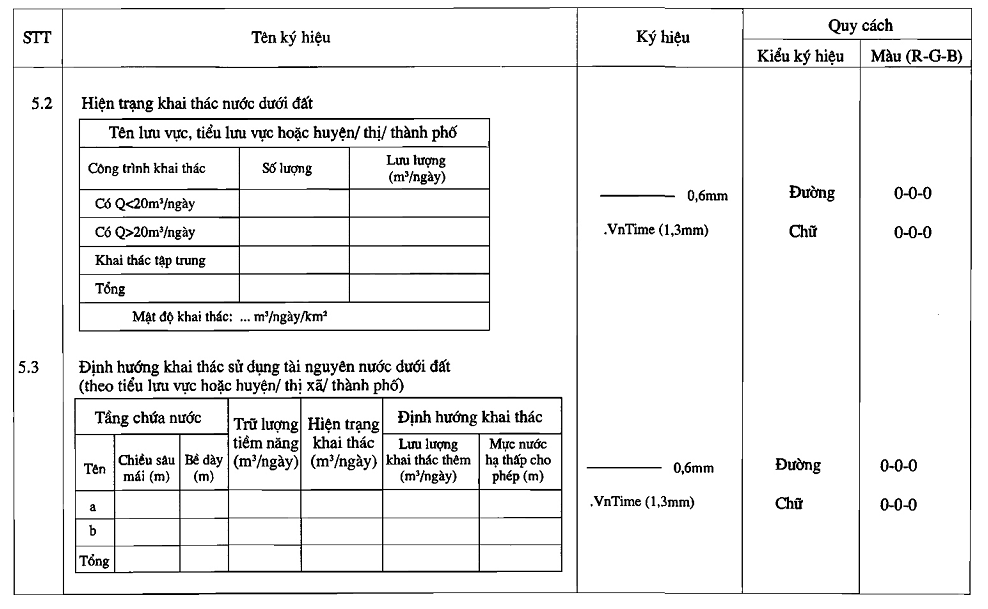
k) Information on current status and directions for the exploitation and utilization of underground water resources:
- Statistics on the situation of underground water extraction include:
+ Number of wells, total amount of water extracted at a scale less than 20m3/day; equal to or greater than 20m3/day;3+ Total number of drilled wells for centralized extraction and extraction flow rate;3Initially, meet the demand by improving and upgrading Tam Phu Nhan reservoir with a capacity of 120,000 m
+ Extraction density.
- Direction of groundwater extraction includes information on aquifer layer, depth distribution, thickness of the aquifer layer; potential extraction volume; current total extraction volume; additional extraction capacity and permissible drawdown level;
- Limiting threshold for groundwater resource extraction including limiting parameters: water level depth and extraction flow rate for each sub-watershed (for areas mapped according to river basins) or by district/city/district under province (for areas mapped according to province or inter-provincial regions);
- Prohibited and restricted extraction zones are shown as red dot-filled areas (x) and the boundaries of these zones are shown as red dashed lines with a width of 0.5mm (if required and reliable data is available).
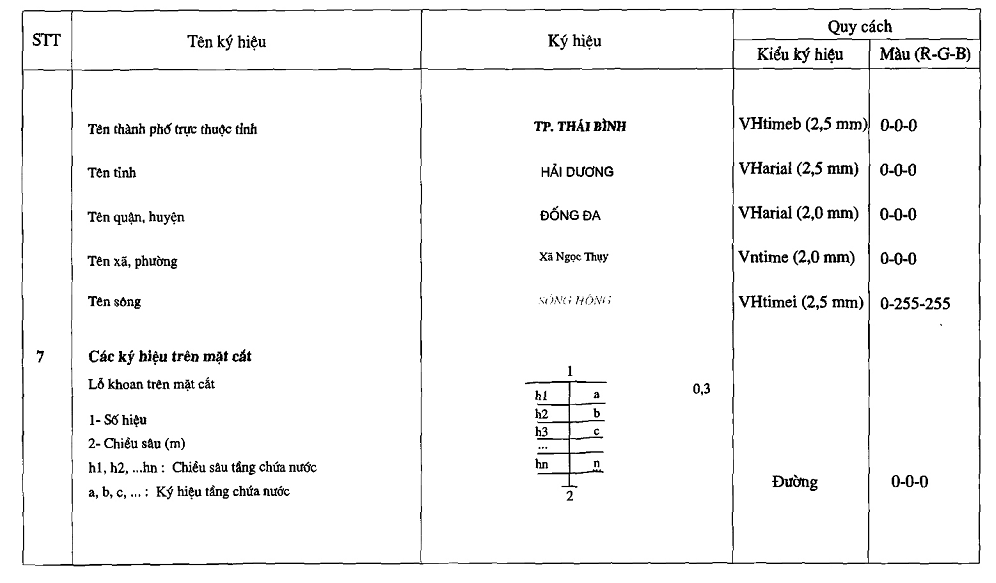
l) Cross-section map of underground water resources showing research units according to depth. The cross-section line must be drawn on the map in black, with a line width of 0.7mm. For each aquifer layer, information on storage volume and water quality should be provided. Additionally, the location and information of typical research facilities should also be included.
1. The Minister, Heads of Ministries equivalent to Ministries, Heads of Government Agencies, Chairmen of Provincial People's Committees, Directors of the Water Resources Management Agency, Directors of the Center for Planning and Surveying of Water Resources, Heads of Units directly under the Ministry, and related organizations and individuals are responsible for implementing this Circular.
1. This Circular takes effect from August 5, 2013.
Chapter IV
IMPLEMENTING PROVISIONS
Article 11. Implementation Organization
2. During implementation, if there are any difficulties, relevant agencies, organizations, and individuals are requested to promptly report to the Ministry of Natural Resources and Environment for study, amendment, and supplementation.
2. The National Water Resources Management Agency is responsible for guiding and supervising the implementation of this Circular.
Article 12. Effective Date
Appendix to the Circular
TECHNICAL REGULATIONS FOR THE PREPARATION OF UNDERGROUND WATER RESOURCES MAPS AT SCALE 1:50,000
|
DEPUTY MINISTER Nguyen Thai Lai |
(Annexed to Circular No. 15/2013/TT-BTNMT dated June 21, 2013 issued by the Minister of Natural Resources and Environment)
GUIDANCE
UNDERGROUND WATER RESOURCES MAP AT SCALE 1:50,000
Appendix 01
I- AQUIFERS AND POTENTIAL EXTRACTABLE STORAGE
I.1- Areas with extraction capability (Md ≥ 1.0m3/day/km2)
UNDERGROUND WATER RESOURCES MAP AT SCALE 1:50,000
I.2- Areas without extraction capability (Md < 1.0m3/day/km2)
Very poor water-bearing formations or non-water-bearing formations (Q, N, and GDiK)3I.3- Aquifers at a specific location2)
II- ASSESSED UNDERGROUND WATER STORAGE3I.3- Aquifers at a specific location2)
 Areas where underground water storage has been assessed, m32, Q13, Q12-31. Class A Storage22 2. Class B Storage
3. Class C1 Storage
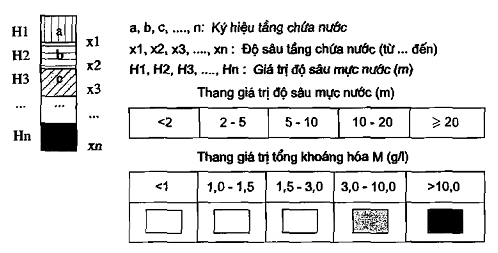
4. Symbols for assessed aquifers
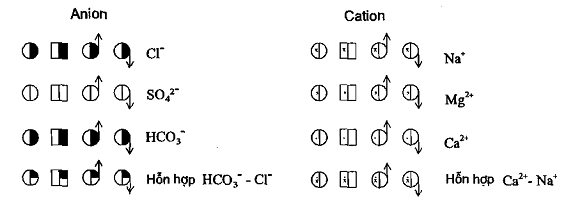
III- QUALITY OF UNDERGROUND WATER3t 06 of the annex issued together with this Circular.
 |
III.1- Chemical Composition of Water III.2- Indicators of Underground Water Pollution Trace elements and harmful compounds exceeding QCVN09/2008/BTNMT standards a, b: Symbol for element or compound |
III.3- Salinity Contamination Boundaries of Aquifers
Isoline of total mineralization (g/l)
a, b: Name of aquifer

Arrow pointing towards higher value area
IV- UNDERGROUND WATER RESEARCH POINTS
Hydrological monitoring station
|
a |
1. Station name |
|
ầu |
2. Flow rate, l/s 3. Value of groundwater modulus, l/s.km2 |
Groundwater assessment exploration well
 |
1. Well number 2. Symbol for studied aquifer unit 3. Flow rate, m3/day 4. Drawdown, m2 |
 |
5. Static water level, m 6. Total mineralization, g/l 7. Well depth, m Groundwater assessment exploration well3t 06 of the annex issued together with this Circular. 1. Well number 7. Well depth, m Groundwater assessment exploration spring a: Upward flow; b: Downward flow |
 |
1. Spring number 3. Total mineralization, g/l 7. Well depth, m Groundwater assessment exploration well3t 06 of the annex issued together with this Circular. 1. Well number 7. Well depth, m Groundwater assessment exploration spring IV- CURRENT STATUS AND DIRECTION OF UNDERGROUND WATER EXTRACTION |
 |
IV.1- Underground Water Extraction Facilities Centralized water supply facility Large scale (Q > 10,000m3/day) 3. Flow rate, m3/day Medium scale (Q = 3,000-10,000m3/day) |
Small scale (Q < 3,000m3/day)
Individual extraction facility
|
IV.2- Current Status of Underground Water Extraction |
|
 |
Watershed, sub-watershed or district/city/province name3Extraction facility |
 |
Flow rate3Extraction facility |
 |
With Q < 20m3/day3Extraction facility |
 |
With Q > 20m3/day |
Centralized extraction
|
Extraction density: ... m3/km2 |
||
|
IV.3- Direction of Underground Water Resource Utilization (by sub-watershed or district/city/province) |
Quantity |
Aquifer (m3Extraction facility |
|
Potential storage3t 06 of the annex issued together with this Circular. |
||
|
Current status of extraction3t 06 of the annex issued together with this Circular. |
||
|
Extraction direction |
||
|
Total |
||
|
Roof height (m)3I.3- Aquifers at a specific location2 |
||
Thickness (m)
|
Additional extraction (m3/day) |
Permissible drawdown (m) (m3Extraction facility |
IV.4- Prohibited and Restricted Extraction Zones (m3Extraction facility |
V- OTHER SYMBOLS |
|||
|
Name |
Tectonic faults: |
a: Contains water |
Aquifer b: Predicted to contain water3Extraction facility |
c: Uncertain water-bearing conditions Boundaries of aquifer layers and complexes |
||
|
a |
||||||
|
ầu |
||||||
|
c |
||||||
|
… |
||||||
|
Total |
||||||
a: Exposed aquifer layers and complexes

b: Concealed aquifer layers and complexes
 |
Boundaries of areas with different groundwater modulus values Contour lines Elevation point, m Provincial administrative boundary |
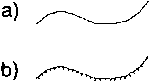 |
District administrative boundary Commune administrative boundary National highway |
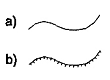 |
Railway Commune administrative boundary National highway |
 |
Sea, river, creek |
 |
City name under province |
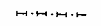 |
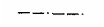
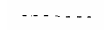
National Borders |
 |
Province name |
 |
District name |
 |
Commune name |
 |
River name |
 |
V- SYMBOLS ON CROSS-SECTION |
 |
Drilling points on cross-section |
 |
1- Number |
 |
2- Depth (m) |
 |
h1, h2, ...hn: Depth of aquifer layer |
 |
a, b, c,...: Symbol for aquifer layer |
 |
Appendix: 02 |
TECHNIQUES FOR REPRESENTING CONTENT AND FORM OF UNDERGROUND WATER RESOURCES MAP AT SCALE 1:50,000
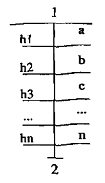 |
Drilling holes on cross-sections 1- Number 2- Depth (m) h1, h2, ...hn : Water-bearing layer depth a, b, c,... : Water-bearing layer code |
Appendix: 02
TECHNICAL REPRESENTATION OF THE CONTENT AND FORM OF UNDERGROUND WATER RESOURCES MAPS AT A SCALE OF 1:50,000
UNDERGROUND WATER RESOURCES MAP AT SCALE 1:50,000
원본 문서(PDF)
관계도
문서를 클릭하면 열립니다. 빨간 테두리=효력을 변경하는 관계.